

| 前页 | 后页 |
使用仿真定义图表
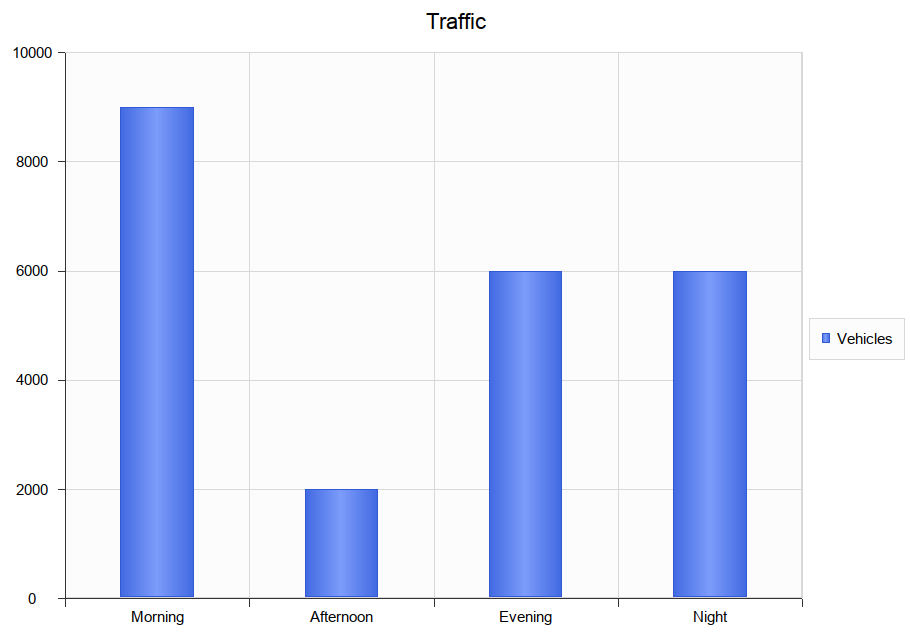
模拟是观察行为的绝佳工具。在仿真中的任何时候,都很容易分辨出我们的位置和状态。在进行仿真时,通常会丢弃此信息。在一个模拟中,向我们显示了24小时内的交通量,我们可以很容易地观察到早上和晚上各个小时通过隧道的车辆数量。在模拟完成后保留此信息,并使用它来提供有意义的信息可能会很有用。 Simulation中的DynamicChart功能使我们能够做到这一点。以上面的示例为例,我们可以记录模拟过程中每个步骤的流量,并使用它生成一个图表,该图表可以清楚地显示出在24小时的模拟过程中通过隧道的流量。图表实际上可以为我们显示模拟的时间轴或一个的总和。
在仿真中生成自定义图表
You can fashion all sorts of Charts from any simulation. Each time a simulation is run, any DynamicChart elements referenced (by name) by the simulation are updated. The simulation will search for any named Chart in the same Package as the model.
Follow this simple process:
- Create a DynamicChart element for the simulation.
- In the initial step of the Simulation, use JavaScript to define a variable to hold the vehicle numbers.
//
// the traffic variable will hold the traffic numbers as simulation proceeds and is initially zero
// each element of the array represents a period of the day, morning, afternoon, evening and night.
//
var traffic = [0,0,0,0]; - Next write the JavaScript that describes, in JSON format, the Chart to produce.
//
// The JSON instance describing the chart to produce. (complies with the EA DynamicChart Schema)
//
var chartData =
{
"Category" : "Column",
"Type" : "Simple",
"Title" : "Traffic",
"Series" :
[
{ "Label" : "Vehicles",
"Data" :
{
"Type" : "Column",
"Points" :
[
{ "Category": "Morning", "Y" : 0 }, // The Y values of the axis are initially zero
{ "Category": "Afternoon", "Y" : 0 }, // they will be filled in at end of simulation
{ "Category": "Evening", "Y" : 0 },
{ "Category": "Night", "Y" : 0 }
]
}
}
]
}; - At various transitions in the simulation update the traffic numbers.
//
// 2000 vehicles went through the tunnel in the afternoon (element 1)
//
traffic[1] += 2000; - At the end of the simulation, use the data captured during the run to fill the series.
// fill points in series with the number of vehicles for each part of the day
var dataPoints = chartData.Series[0].Data.Points;
for(var dp = 0; dp < traffic.length; dp++)
{
dataPoints[dp].Y = traffic[dp];
} - Update the model.
// Call the EA function to populate the DynamicChart element named 'Vehicles' with this data.
sim.GenerateChart( "Vehicles", JSON.stringify(chartData));
仿真产生的默认图表
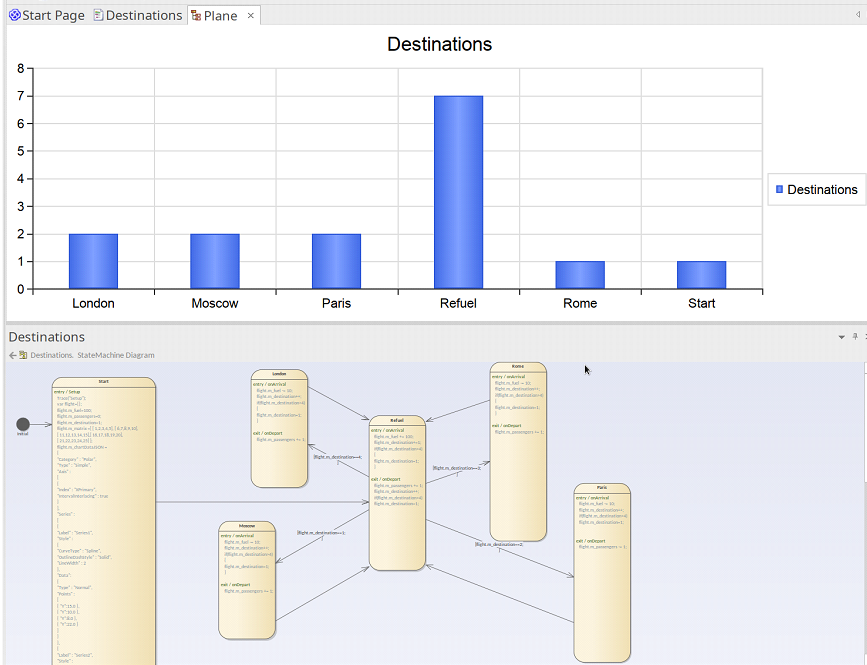
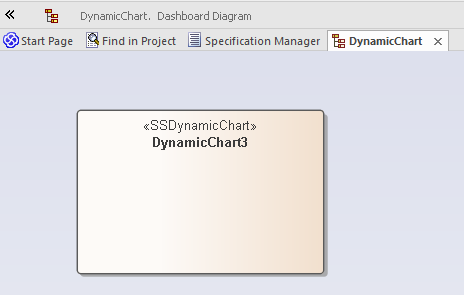
In addition to Charts you specifically produce, a summary Chart can be produced automatically by a simulation. All that is required is adding a DynamicChart Artifact to the Package and giving it the same name as the StateMachine. The default Chart summarizes the State transitions taken during execution of a simulation. If a default Chart is found when the simulation completes, that Chart's data is updated, and displayed automatically.
To add a default Chart to your StateMachine simulation follow these steps:
- Locate the Package containing the StateMachine on which to perform the simulation.
- Create a Dashboard diagram as a child of that Package.
- Add a DynamicChart Artifact to the Dashboard diagram, and give it the same name as the StateMachine.
When the simulation ends, simply open the Dashboard diagram to reveal the summary.