

| 前页 | 后页 |
使用JavaScript的图表定义
在本主题中,我们讨论仅使用JavaScript和Chart自动化界面对DynamicChart Artifact进行编码。
通过JavaScript定义图表
The first thing you do is create a Dashboard diagram in the appropriate Package. Right-click on the Package and select the 'Add Diagram' option.
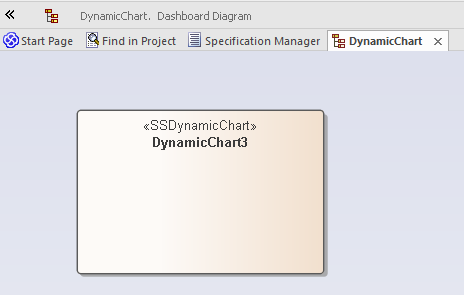
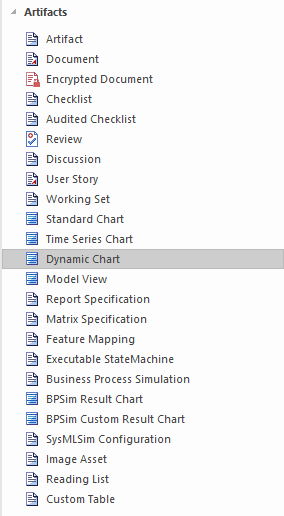
On the 'New Diagram' dialog select the type 'Construction > Diagrams and Charts' and, when the empty diagram displays, drag the DynamicChart icon onto it from the Artifacts page of the Toolbox.
Now you write the JavaScript to style and render the Chart, starting with the ConstructChart function that will be invoked automatically whenever the diagram containing the DynamicChart Artifact is opened for viewing. The GUID of the element is passed to ConstructChart as a parameter. Within this function, it is entirely up to you what type of Chart to display, the style of the Chart, the number of series it contains, and the data points that make up the series. Using the Chart Package from the Automation Interface, it is possible to display almost any Chart you require.
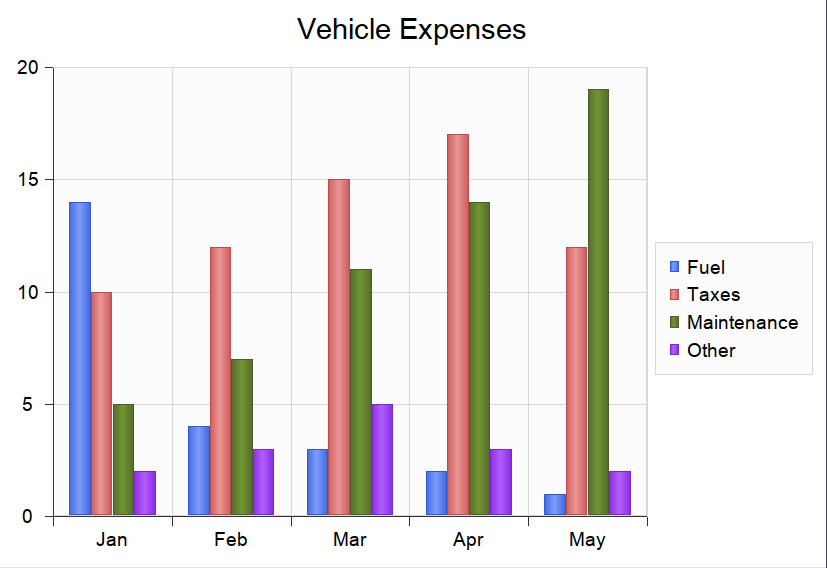
In this example you will create a Grouped Column Chart that shows vehicle expenses over a few months. Each group will represent a month and will be broken down into the different expenses incurred during that month.
To begin, click on the Artifact and press , or click on the 'Edit Chart Script' context menu option; each method displays the Code Editor window. The code to use is provided here, followed by the Chart it will produce when the diagram is opened.
Importantly, note:
- The !INC Local Scripts.ChartAutomation statement; all Chart scripts must include this statement
- The ConstructChart function (7th line in)
码
!INC Local Scripts.ChartAutomation
var monthNames = [ "Jan", "Feb", "Mar", "Apr", "May", "Jun", "Jul", "Aug", "Sep", "Oct", "Nov", "Dec" ];
function Rand(min, max) {
min = cephes.ceil(min);
max = cephes.floor(max);
return cephes.floor(cephes.drand() * (max - min)) + min; }
function ConstructChart( guid )
{
var chart as EA.Chart; // The script first of all
var element = GetElementByGuid(guid); // declares the automation
var series1 as EA.ChartSeries; // objects it will use
var series2 as EA.ChartSeries;
var series3 as EA.ChartSeries;
var series4 as EA.ChartSeries;
chart = element.GetChart();
var chartCategory = ChartCategory.Column();
var chartType = ChartType.SIMPLE();
chart.SetChartType( chartCategory, chartType, false, true);
chart.Title = "Vehicle Expenses";
series1 = chart.CreateSeries("Fuel"); // The script then obtains the Chart object and creates the
series2 = chart.CreateSeries("Taxes"); // series. A chart is composed of a number of series, and
series3 = chart.CreateSeries("Maintenance"); // in this example each series will represent a type of expense.
series4 = chart.CreateSeries("Other");
series1.AddDataPoint3( monthNames[0], 14); // A series is composed of a number of datapoints and, here, the
series1.AddDataPoint3( monthNames[1], 4); // script adds the values for each of the points to each series.
series1.AddDataPoint3( monthNames[2], 3);
series1.AddDataPoint3( monthNames[3], 2);
series1.AddDataPoint3( monthNames[4], 1);
series2.AddDataPoint(10);
series2.AddDataPoint(12);
series2.AddDataPoint(15);
series2.AddDataPoint(17);
series2.AddDataPoint(12);
series3.AddDataPoint(5);
series3.AddDataPoint(7);
series3.AddDataPoint(11);
series3.AddDataPoint(14);
series3.AddDataPoint(19);
series4.AddDataPoint(2);
series4.AddDataPoint(3);
series4.AddDataPoint(5);
series4.AddDataPoint(3);
series4.AddDataPoint(2);
series1.SetGroupID(0);
series1.SetGroupID(0);
series3.SetGroupID(1);
series4.SetGroupID(1);
chart.Redraw();
}
输出量
这是代码产生的图表。
示例模型(“ EA 15示例>动态图表”包)中提供了其他编码示例。每个“图表”示例都提供一个仪表盘图和一个DynamicChart元素。选择这些元素中的任何一个,然后按Alt + 7以查看图表后面的行为代码。参考这些示例是理解如何对每种图表类型进行编码的最佳方法。
JavaScript是使用自动化对动态图表进行编码的主要语言。但是,让第三方自动化客户端参与该过程当然是可行的,JavaScript主机使用C#和C ++等语言将任务委派给自动化客户端,这可能能够以某种方式从模型外部获取数据不适用于脚本。